What The Framework Is All About
I developed a framework of PCA (R programming language). One of the most wonderful factors of it is the function to compress multidimensional vectors into three dimensions easily. This function helps you draw N types of data (N≧4) and want to plot these data into a graph. If you don't know it, you have no choice but to draw those data using nC2 patterns of graphs. The core of the function is "PCA" (Principal Component Analysis). PCA is one of the solution methods for data analysis. PCA is very useful solution methods. However, the formula is very complex. So, it is very hard for ordinary people to use PCA. The framework which I developed solve this problem, because how to use it is very simple! Let's try my creation!
How To Use
First Step
Data with multiple items in a single data set is created with Excel or other software and exported to a CSV file.
This data will generate an error warning message when loaded, but this is not a problem for plotting the graph, so please ignore it.
Second Step
Install R and RStudio following links.
Third Step
Copy the following R commands and paste them into the RStudio terminal.
               #Copy under the commands
               install.packages("rgl")
               install.packages("pca3d")
               install.packages("devtools")
               devtools::install_github("vqv/ggbiplot")
Last Step
Edit the following commands to fit your data and environment, then copy and paste them into the RStudio terminal. I made two types of PCA. Choose your favorite graph design.
Type 1
#This is sample code
#Edit and copy under the commands
library("ggbiplot")
#Loading Data
A=read.csv("G:/sample.csv")
A=data.frame("A"=A)
A<-A[2:7]
#Assigning Group Information
A[1:914,] <- A[1:914,] + 1
A[915:1123,] <- A[915:1123,] + 2
A[1124:1244,] <- A[1124:1244,] + 3
A[1245:1299,] <- A[1245:1299,] + 4
A<- cbind(c(rep("V violacea Makino", 914),
rep("V violacea var.makinoi harima",209),
rep("V violacea var.makinoi", 121),
rep("V sieboldii", 55)),
A)
colnames(A) <- c("types","L1","L2","L3","L4","L1/L2","L1/L4" )
#PCA
W <- prcomp(A[, 2:7], scale = FALSE)
#Specify prcomp() or princomp() results: pcobj option
#Specify principal components to plot: choices option
#Specify group information: groups option
#Describe probability ellipses for each group: ellipse option
#Draw correlated circles: circle option
#The ggplot2 command is available
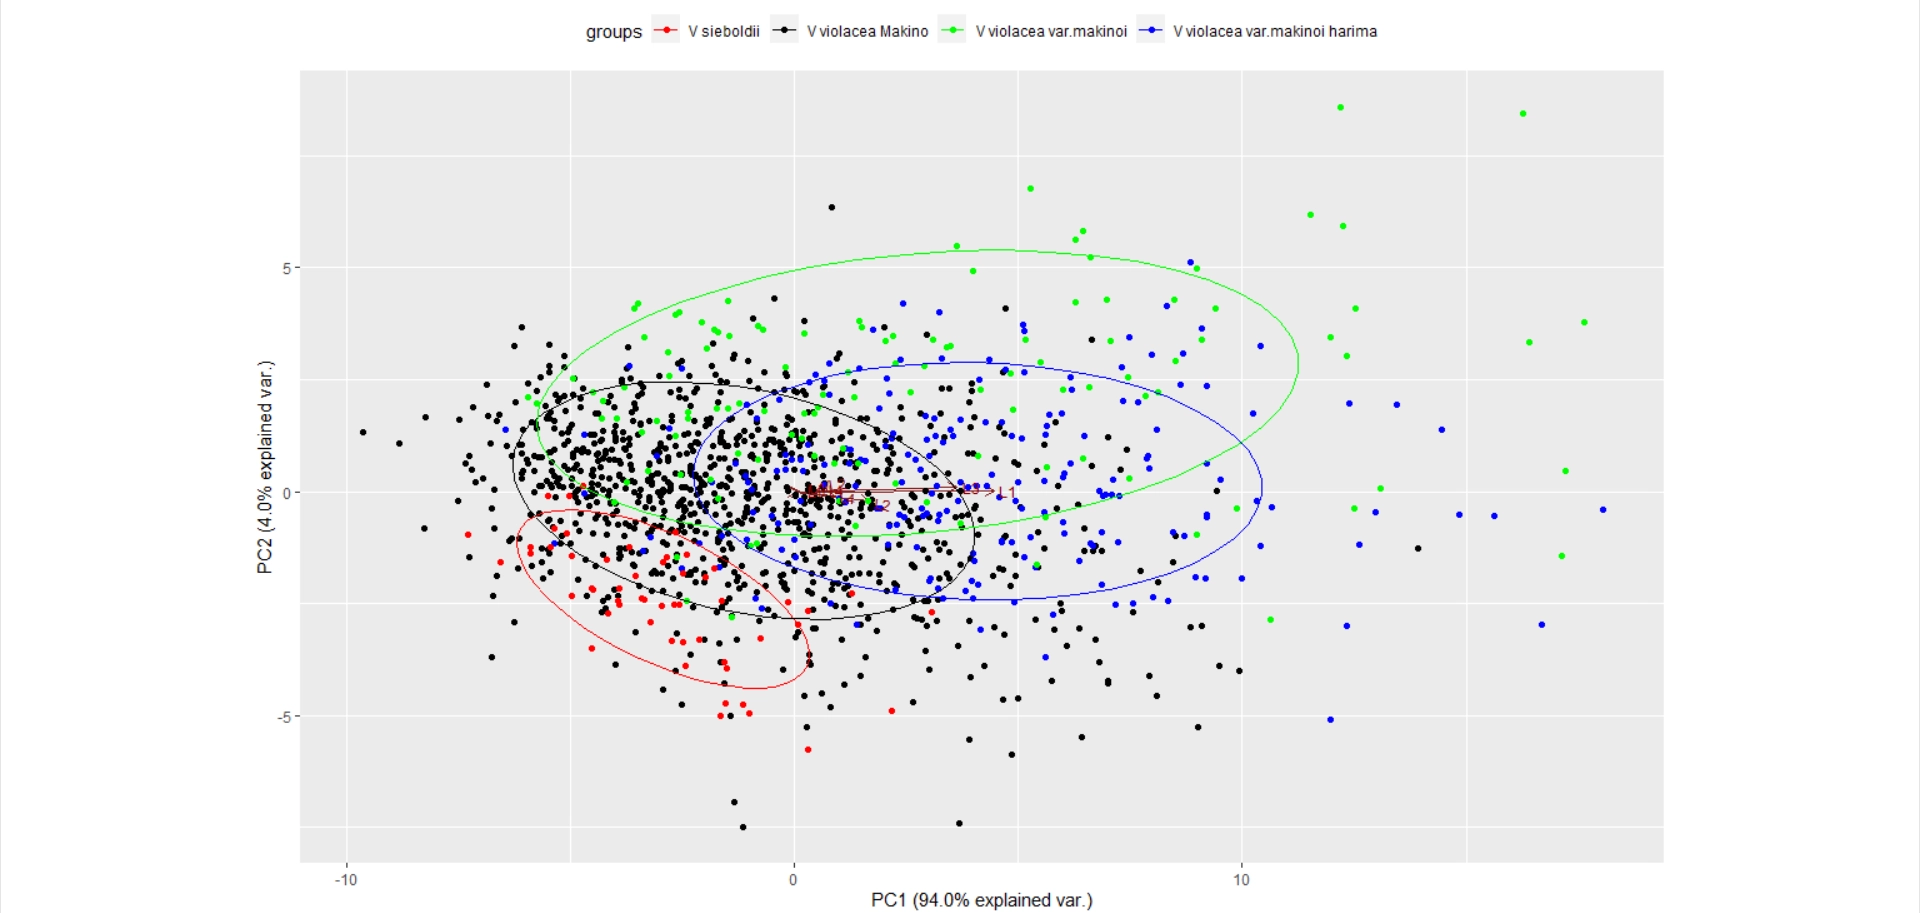
ggbiplot(pcobj = W, choices = 1:2, obs.scale = 0.5, var.scale = 2,
groups = A[, 1], ellipse = TRUE, ) +
scale_colour_manual(values = c("#FF0000", "black", "#00FF00","blue")) +
theme(legend.direction = "horizontal", legend.position = "top")
Result
Type 2 (This code will produce both 2D and 3D graphs.)
#This is sample code
#Edit and copy under the commands
library(rgl)
library(pca3d)
#Loading Data
A=read.csv("G:/sample.csv")
A=data.frame("A"=A)
compiled_A<-A[2:7]
pca <-prcomp(compiled_A,scale=FALSE)
#Labeling: group option
#Drawing planes: show.plane options
#Drawing ellipses: show.ellipses options
pca2d(pca,
group = A[,1],
show.ellipses=TRUE,
ellipse.ci=0.9,
show.plane=TRUE,
fancy= TRUE)
#Labeling: group option
#Drawing planes: show.plane options
#Drawing ellipses: show.ellipses options
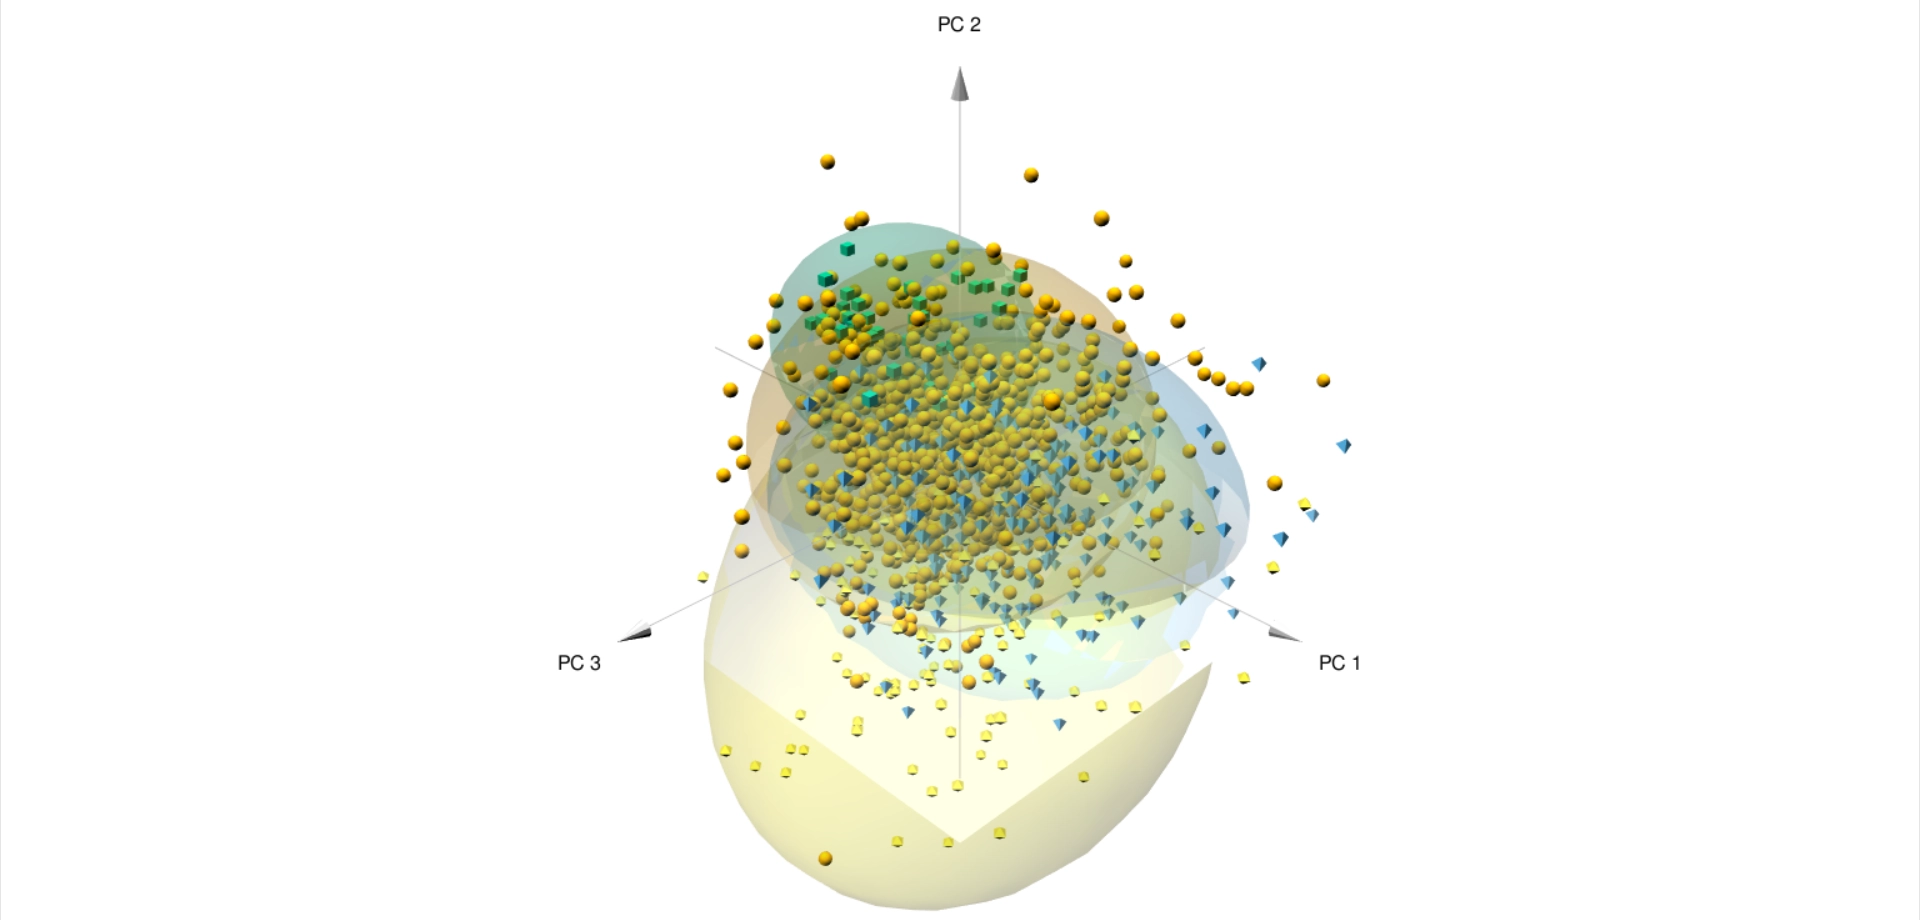
pca3d(pca,
group = A[,1],
show.ellipses=TRUE,
ellipse.ci=0.9,
show.plane=TRUE,
fancy= FALSE)
Result (Type 2, 2D Graph)

Result (Type 2, 3D Graph)